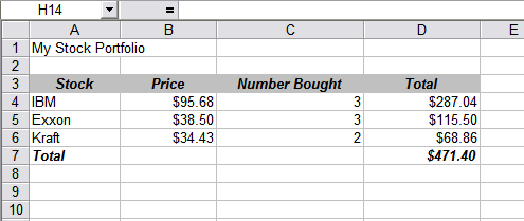
You can use Excel to track your stocks. Create a table like the one you see below.
Use column A to enter the name of the stock you want to buy
Use column B to enter the price of the stock (the first price you see is the closing price. That is the one to use).
Use column C to enter the number of stock shares you wish to buy. You have to pay the cost you entered in column B for EACH share you buy. So if Exxon costs 38.5 dollars and I buy 3 shares, I pay 3 times 38.50 or 115.50 dollars.
Use column D to enter the TOTAL YOU PAY FOR ALL YOUR SHARES. If you want the computer to calculate this for you, just enter this line in the cell:
=B5*C5 The video below will explain in more detail.
Here you ask the computer to make the cell equal what is in cell B5 times what is in cell C5. The computer will do the math for you.
Now lets total the investment up. You have $700 dollars to spend.
Use the ![]() command on your tool bar to
sum up the numbers in column D. You may not spend more than $500.
You can spend less.
command on your tool bar to
sum up the numbers in column D. You may not spend more than $500.
You can spend less.
